Google Analytics can be intimidating for beginners because there’s only data, data, data, that’s all there is to it.
Take a deep breath, because what Google Analytics for beginners(GA from now on forth) is not really that complex. It not only reveals data of your website but also show the result of your marketing efforts.
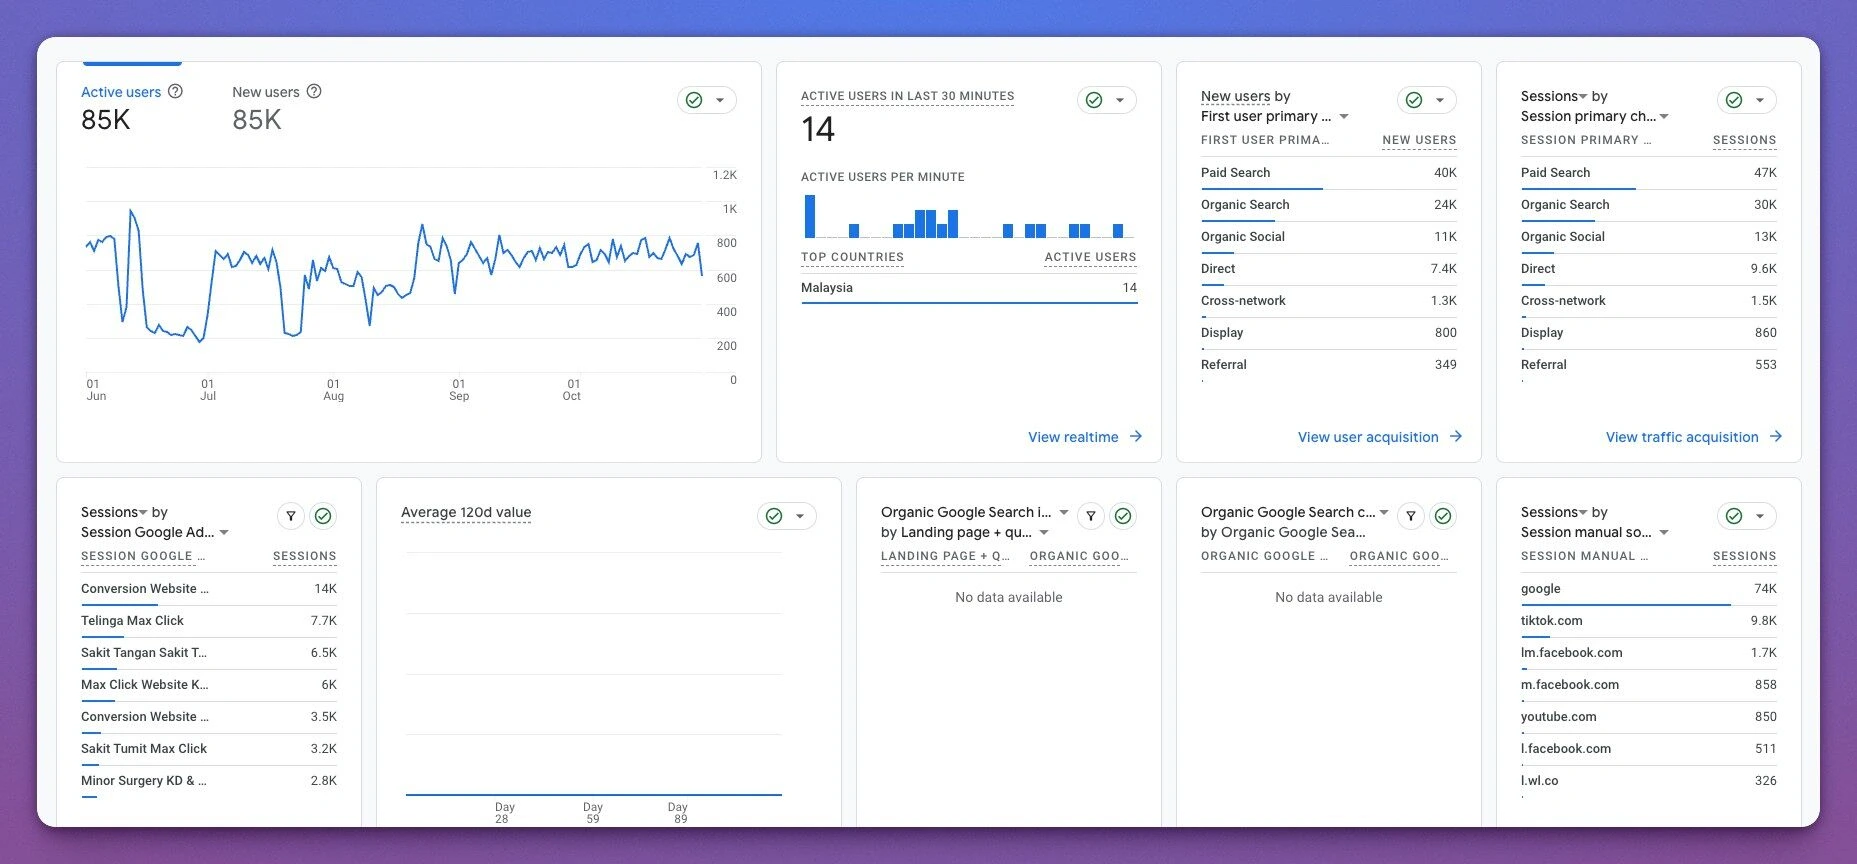
In this post, I’ll walk you through important data so you can understand and do something to fix it. My aim is to make this post as short as possible so I don’t waste your time on needless parameters. Let’s start the Google Analytics for Beginners.
Before you start, I want you to enter a mindset
- Google Analytics (GA) is easy
- Don’t benchmark against others, only against your previous period
- Every business, website, industry is different.
Table of Contents
1. Time on Page
The most common pitfall for Google Analytics for beginners is overlooking the time spent on a single page. There is an average (for the entire website) and the time on a single page. Average Time on-page can be seen at Lifecycle → Engagement → Overview.
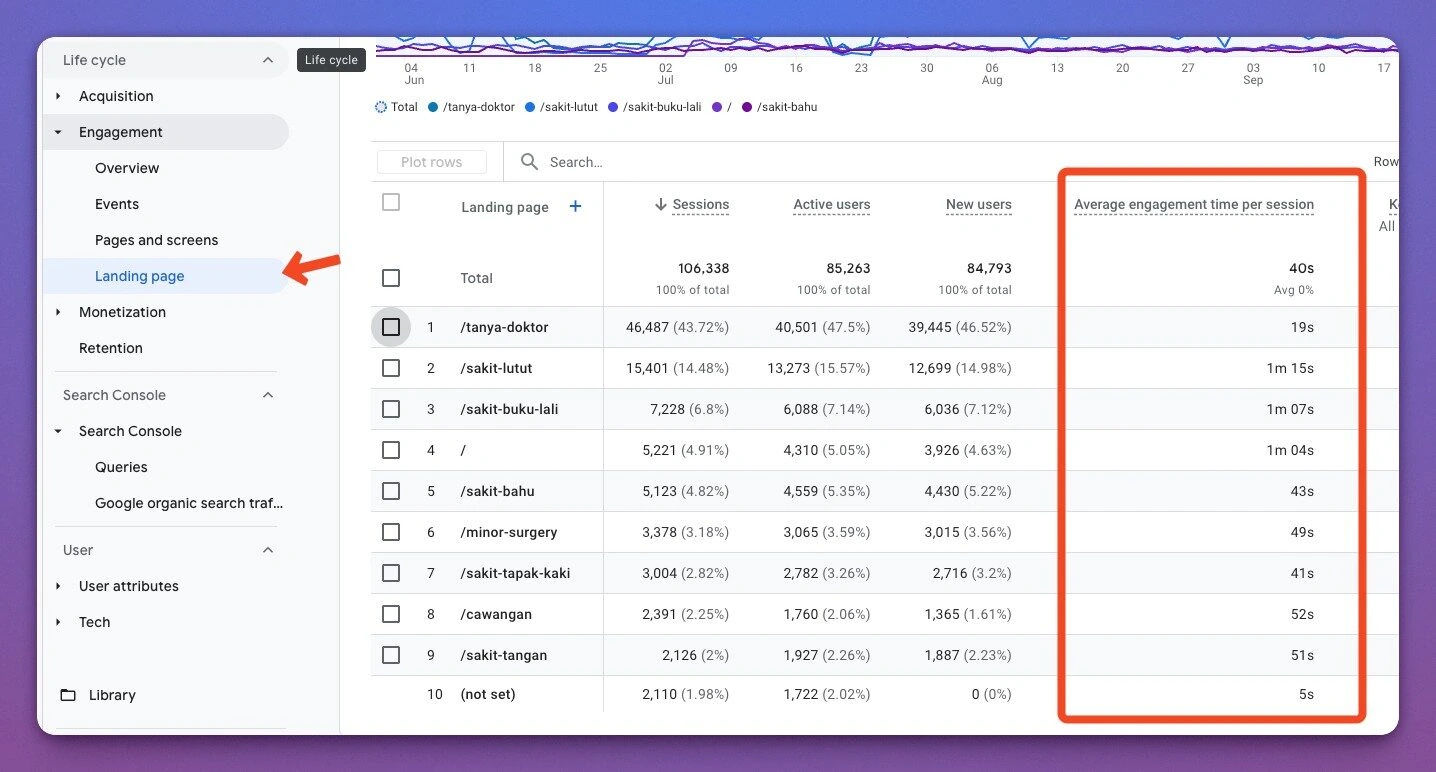
Time on Page is important for SEO. If your content is high quality and helpful, people will stay a little longer and Google definitely wants to serve you content to your audience.
Metric: Higher Time on Page is Better.
For Articles, blog post, events, news:
Check the number of words, divide by 200 (200 is the average adult reading speed), you get the number of minutes they should spend on your website.
- Here’s what you can do to lengthen the visit.
- Serve a video (a great way to keep them longer on the page)
- Add sophisticated diagrams (yes it works)
- Serve Slides from Scribd or Slideshare
For Products:
If the time is too short (like 5 seconds), here’s what you can do
- Change the Offer (discounts)
- Use sharper and professional images or photos.
- Improve the Copywriting
- Add video explainer
- Add testimonials (visitors are hooked on reading testimonials)
- Improve the design and layout
If the time is between 30 seconds to 1 minute (provided you’ve done above),
- Explain every feature your product has how it can solve the problem
- Offer risk reversal like guarantees
- Downloadable content like reports, case studies in PDF.
- Add Chatbox or Chatbot
2. Site speed
Every visitor has different connectivity speed to your website, depending on the device (mobile, desktop, tablets, etc).
You can check site speed at Behavior > Site Speed > Page Timing
Site Speed is also important for SEO because search engine prefers to send traffic to fast websites.
Metric: The lower the better. You want to get below 5 seconds mark.
If your website is slower than 5 seconds, try the following
- Optimize the image, use the right image for the right size. I.e. don’t serve a huge picture direct from camera to website, crop it to the right screen size.
- Use Cache plugins. There are plenty of cache plugins for WordPress. If you run
- Use CDN. CDN like CloudFlare is easy to use and serves your code faster
- External Image server like AWS S3 (complex) or Optimole (simple WordPress plugins)
- Use WP Stateless, this uses Googles’ server (and charges may incur) to serve your image.
- Upgrade your server (from shared hosting to dedicated)
- Improve your coding (you may need help with this)
- Unload unused CSS and JS using WP Plugin or Perfmatters
- Reduce dependency on external CSS JS (serving outside your server)
3. New vs Returning Visitor
New visitors are people who just learned about you. Returning are (maybe) your leads or customer, visitors who know you. Learn more about the different between Visitors and Customers in Funnel Marketing.
This can be found in Lifecycle → Acquisition → User acquisition
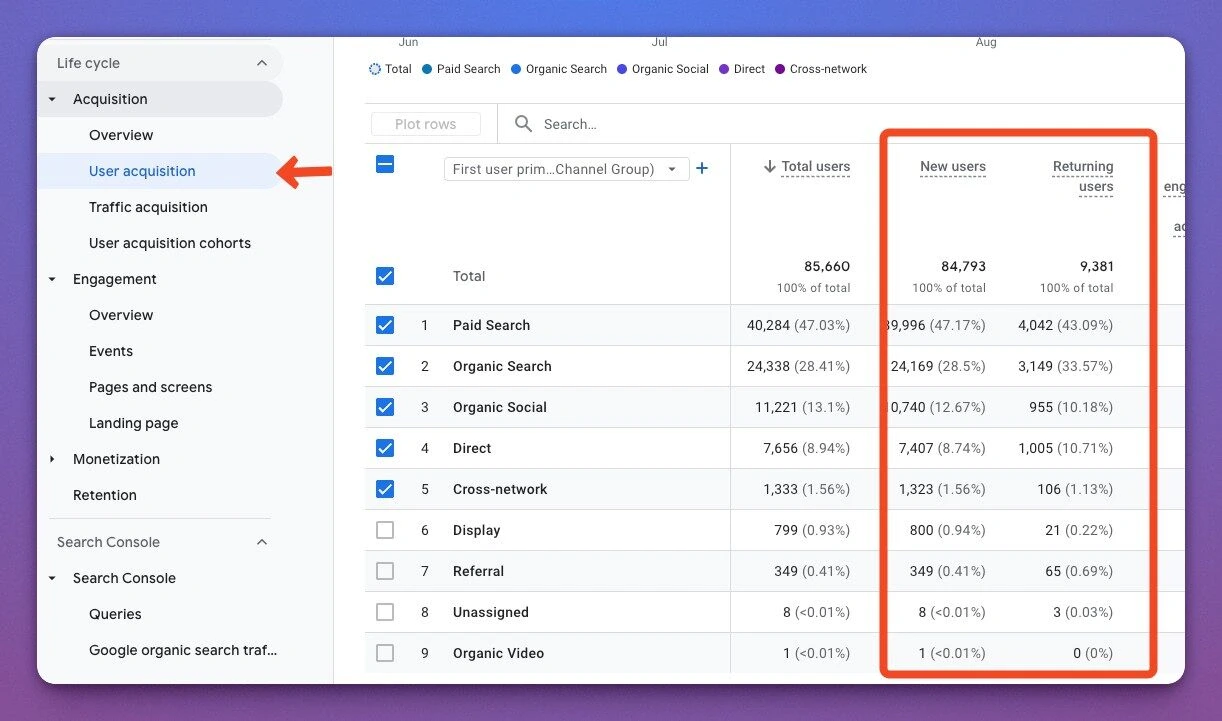
Metric: Depends your marketing strategy and goals
If you …
1. Do pay for Traffic (via Google Ads, Facebook ads, Influencers, Bloggers), expect your website to have more New visitors.
2. Do Content Marketing, expect the ratio to be 50:50.
3. Do send out newsletters, expect your returning customers to be more than new ones.
4. Do retargeting campaigns, expect more returning customers.
For example, Laman7.
When I write a blog post, it’s normally for my customers. I send out newsletters every now and then to share our new blog post. I’d expect more returning visitors than new ones.
“5-20% probability of selling to new prospect”
“60-70% probability of selling to the existing customer”
– Marketing Metric.
4. Traffic Source
Where do your visitors come from? To check this, go to Lifecycle → Acquisition → Traffic acquisition
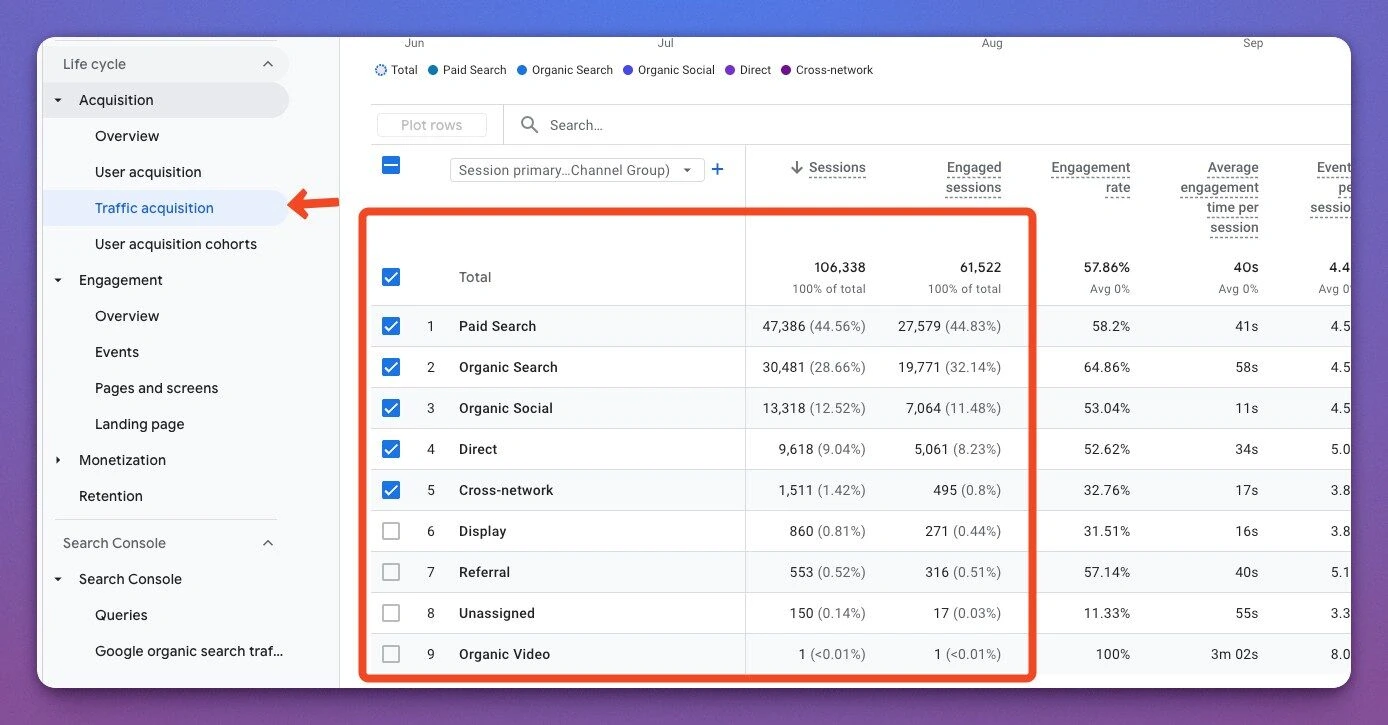
This is the metric I cared most, because it shows how people found me.
Metric: Depends on Marketing Strategy and Goals
Let’s say I invest in making content on Facebook, I expect the traffic from Facebook to be more than anything else.
Likewise, if I invest in Content Marketing (blogpost), I’d expect more from Organic searches.
If I have a billboard, I’d expect more from Direct.
If I pay people to write about me, I’d expect more from referrals.
You want to be extremely good at one source, average for the rest. Buying traffic is the easiest way to get noticed. SEO will take a while and can be daunting for beginners.
5. Number of Visitors
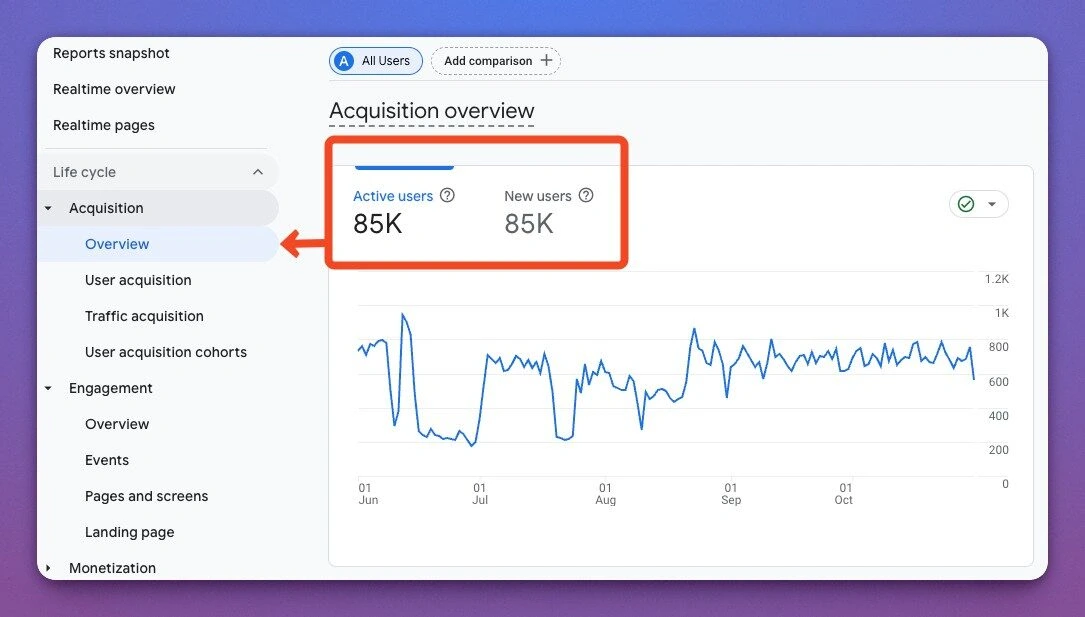
Check the week-to-week (or month-to-month) growth.
You can do this by going to Lifecycle → Acquisition → Overview. Then on the top right, click on the dates. Check compared to the previous period.
Metric: Anything positive, you want growth.
In my example, we’re experiencing a decrease in visitors. That’s ok because our post went viral, so I do expect it to go down once the content is dated.
To keep growing your traffic you can do 2 things.
- Invest in Content Marketing. Share valuable (helpful) content to visitors and don’t expect anything in return.
- Pay for traffic. This is the cheapest way to grow your visitor, but it may be costly in the long run if you don’t have ROI on your ads spending.
6. Pages per Session
How many pages were visited in a single session?
Google somehow decided to remove this from the GA4. Making it difficult to search for “Views per page session” without some settings.
I recommend you follow this tutorial →
This metric determines the pages that visitors go through during their visits.

To view, go to
Metric: High page per session the better.
This correlates to the number of products and types of websites.
Blog content: 2-3 pages per session. Visitors find what they need helping with, solve the problem and closes the website
eCommerce (online shopping): More than 4 pages per session. You want them to check products after products. Once they are ready to buy, they go to the checkout page to make payment.
Corporate Website: 4-5 pages per session. You want visitors to learn about your product and services. And sometimes learn about your company, vision, top management, etc.
- Ways to Improve Page per Session.
- Add related content at the bottom of the product page, blog page, news and/or events
- Add links to other pages in Static pages (About us, Location, Top Management, etc)
- Create a flow of pages, like how we did with our manifesto.
- Add quizzes to increase engagement
7. Popular Pages
Know exactly which page is popular because this page might be your best selling product or blog post.

To view go to: Behavior > Site Content > All Pages
Metric: Depends on your goal.
What do we do with a non-performing page? Here’s what you can do.
If it’s a blog post
- Add more ‘meat’ to it. Previously 500 words, push to 1000 words.
- Add other types of media, like diagrams, well-designed icons, infographics, relevant videos.
- Combine with other posts and make it a Mega post (remember to do ‘301 redirect’ to old post)
If it’s a product or services page
- Add links (Call to Action) from a relevant blog post.
- Improve the copywriting, images, content.
- Add a video explainer about the product.
- Send paid traffic to the page.
Here’s my basic workflow to producing content (blog post), steps are in order.
- Identify the problem of your customer
- Verify with one or two customers
- Post something short on Facebook.
- If it picks up, has shares and likes, I start writing 500-600 words.
- Post on the blog, share it on social media.
- If the post generates traffic, I add other types of media and content. Keep improving the content.
- If it continues to grow, I pay for the traffic to reach more people.
- Break the content into small pieces and share on Social Media.
Moving Forward
Here’s a simple template that I personally use to track Google Analytics. You can open it and ‘make a copy’ and make it your own. Or if you prefer PDF, download here.

Print this out for every month. Write it down and keep it in a file. Another method is to use Google Data Studio, which I won’t be covering in this post.
Bonus Google Site Kit
Google has recently released Google Site Kit for WordPress. It makes it so much easier to see Google Analytics from your website. You can download here and install in your WordPress.
Looking for SEO Expert?
You can work with me for your SEO in Malaysia. Great for the oversea customers because I charge 50% less than what you would normally pay for.
Questions? Leave in the comments below. Subscribe if you’d like these content in your inbox.


